
Shadow AI inherits your users' OAuth tokens and API keys to silently access app data. This guide walks you through building four detection layers directly into your SaaS product using Rocket.new, from spotting suspicious signals to revoking access in one click.
Shadow AI is any AI tool operating inside your organization without IT approval, and it's the fastest-growing blind spot in SaaS security today. This guide shows you how to build a shadow AI detection system directly into your SaaS app using no-code techniques: API fingerprinting, access-volume anomaly alerts, a connected-apps dashboard, and one-click revoke, all without an enterprise security budget.
What Shadow AI Looks Like Inside a SaaS App
Shadow AI is any AI tool or service that operates inside your application's environment without formal approval from IT or security teams. It includes browser extensions, personal AI assistants, and third-party AI agents that access your app's data through inherited user permissions.
The critical difference from traditional shadow IT: shadow AI tools don't just store or share files. They actively read, analyze, and sometimes retain the data they access. A Dropbox installed without permission holds your files. An AI agent connected through OAuth reads, summarizes, and potentially trains on them.
According to UpGuard's research, 81% of employees use unapproved AI tools at work, and shadow AI usage surged 156% between 2023 and 2025. Shadow AI-related breaches cost $4.63 million on average. And only 37% of organizations have policies to manage AI usage or identify shadow AI activity.
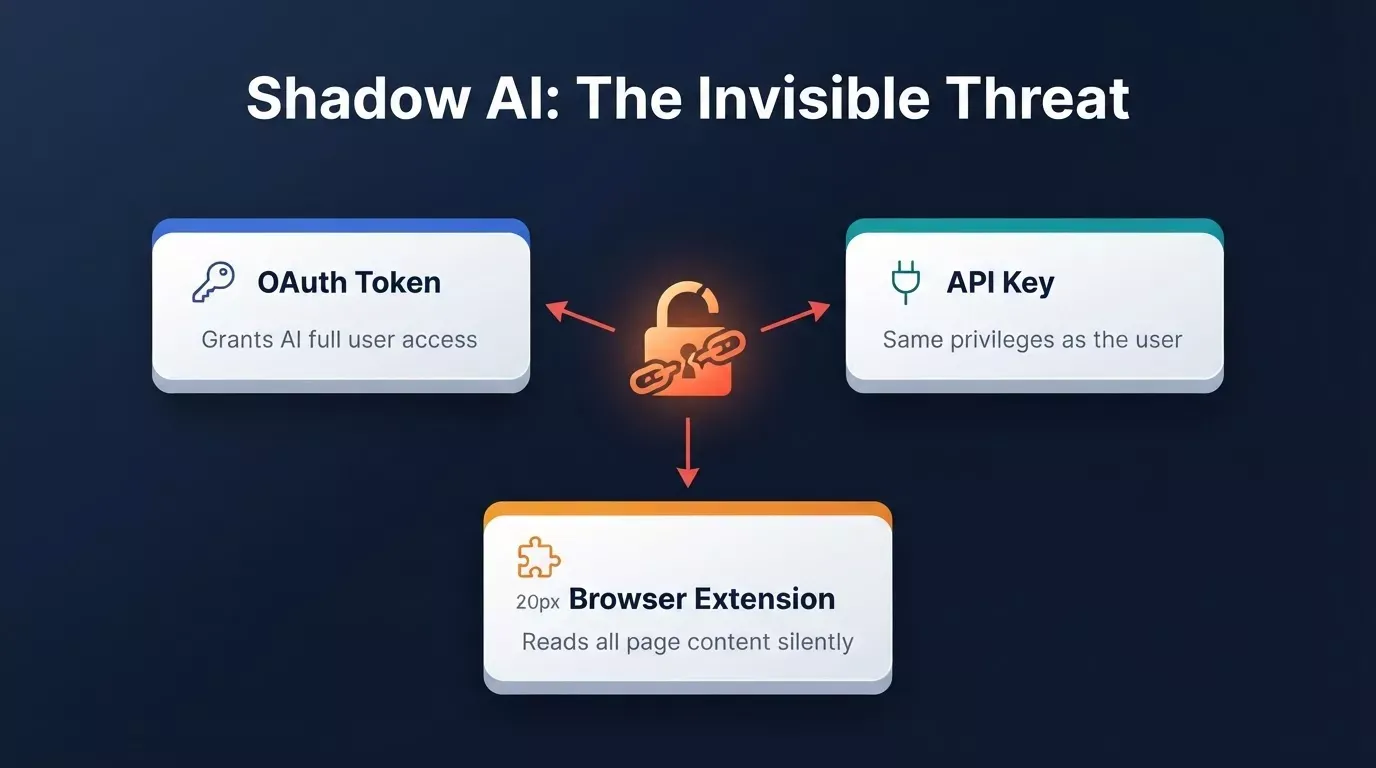
Shadow AI enters through the same doors your legitimate users use: OAuth tokens, API keys, and browser extensions.
Example SaaS Architecture and Attack Scenario
To make this concrete, consider a typical B2B SaaS app: a project management tool with a Next.js frontend, a Supabase Postgres backend, and OAuth-based login. Users can invite teammates, create projects, and upload documents.
Here is how a shadow AI attack unfolds in this architecture:
A contractor on your platform installs an AI productivity assistant that promises to summarize project updates. During setup, the assistant requests OAuth access using the contractor's existing Google login, which your app already trusts. The assistant receives a valid session token with the same read permissions the contractor holds.
Over the next 48 hours, the AI agent silently calls your /api/projects and /api/documents endpoints in rapid sequential batches, exporting summaries of every project the contractor can see, including ones belonging to other team members. Your firewall sees nothing unusual because the requests come from a valid authenticated session. Your DLP tool sees nothing because the traffic is HTTPS and browser-routed.
What makes this scenario typical, not exceptional:
- The contractor never intended to expose data. They just wanted a productivity tool.
- No vulnerability was exploited. The AI used the same access path as the human.
- The breach is invisible until you look at request logs and notice machine-speed sequential access patterns.
This is the attack surface you are building against.
What Signals Can Identify Suspicious AI Activity
Before building any detection layer, you need to know what you are looking for. Shadow AI activity leaves a distinct fingerprint across three signal types.
User-agent strings are the first signal. Human browsers send headers like Mozilla/5.0 or Chrome/126. AI agents and automation tools send headers like python-requests/2.31, anthropic-sdk/0.21, openai-python/1.3, or custom strings. These are programmatic, not browser-generated, and they appear in your API logs on every request.
Request timing and sequencing is the second signal. A human navigating your app generates irregular, human-paced requests with pauses between actions. An AI agent generates rapid, uniform, sequential requests, often hitting the same endpoint family repeatedly with incrementing IDs or pagination parameters. The interval between requests is measured in milliseconds, not seconds.
Data volume per session is the third signal. A human user in a 30-minute session might read 15-20 records. An AI agent in the same session window might read 3,000-5,000 records, often in a single burst. The volume-to-session-time ratio is the clearest anomaly signal you have.
| Signal Type | Human Pattern | AI Agent Pattern |
|---|---|---|
| User-agent header | Browser string (Mozilla, Chrome) | SDK or script string (python-requests, anthropic-sdk) |
| Request interval | Irregular, 2-30 seconds between actions | Uniform, under 200ms between requests |
| Records per session | 10-30 typical | 500-5,000+ typical |
| Endpoint access pattern | Mixed navigation across pages | Sequential, single-endpoint bulk reads |
| Session duration vs volume | Low volume over long session | High volume in short burst |
These three signals, combined, give you a detection surface that no firewall or DLP tool currently monitors. Now you will build each layer.
Build Layer 1: Log Suspicious API Activity in Rocket.new
The first layer is a middleware component that intercepts every API request and logs the signals that matter. You are not blocking anything yet. You are building visibility.
What to build: A request-logging middleware that captures, for every authenticated API call: the user ID, the user-agent string, the endpoint called, the timestamp, and the response size. Store these logs in a Supabase table with a session_id column so you can group requests by session.
How to build it in Rocket.new: Open a new Build task and describe what you need:
Build a Next.js API middleware that logs every authenticated request to a Supabase table called api_request_logs. Log: user_id, user_agent, endpoint, method, timestamp, response_size_bytes, and session_id. Flag requests where user_agent contains any of these strings: python-requests, anthropic, openai, claude, gpt, requests/, urllib, aiohttp, httpx.
Rocket.new generates the middleware file, the Supabase table schema with the correct column types, and a migration script you can push directly. Connect your Supabase connector once, and it flows into the build automatically.
What you get: A live log of every API request, with AI-tool user-agents pre-flagged. This is the raw data that feeds every other layer.
Before you ship this layer, run through Rocket.new's security checklist, which covers API key protection, authentication, row-level security, and private data handling. Your log table will contain sensitive access data and needs RLS policies from day one.
Build Layer 2: Detect Unusual Access Volume
With request logs flowing into Supabase, you can now build the anomaly detection layer. This layer reads the logs and fires an alert when a session's access volume crosses a threshold that no human user would reach.
What to build: A Supabase Edge Function that runs on a schedule (every 5 minutes) and queries the api_request_logs table. For each active session in the last 10 minutes, it calculates: total requests, unique endpoints accessed, and records returned. If any session exceeds your threshold, it writes a row to an anomaly_alerts table and sends an email via SendGrid.
How to build it in Rocket.new:
Add a Supabase Edge Function called detect-volume-anomalies that runs every 5 minutes. Query api_request_logs for sessions active in the last 10 minutes. Flag any session with more than 200 requests or more than 500 records returned. Write flagged sessions to an anomaly_alerts table with: session_id, user_id, request_count, record_count, flagged_at, status (default: open). Send an email alert via SendGrid to the admin address in the environment variables.
Rocket.new generates the Edge Function code, the anomaly_alerts table schema, and the SendGrid integration. Your 26+ connectors handle authentication for both Supabase and SendGrid from a single prompt.
What you get: Automated anomaly detection that fires within 5 minutes of a suspicious session. You do not need to watch logs manually. The system tells you when something is wrong.
Build Layer 3: Build the Connected Apps Dashboard
The third layer makes shadow AI visible to your users, not just to your admin team. Most users genuinely do not know how many third-party tools have active access to their accounts. Showing them is the fastest way to reduce shadow AI without any enforcement overhead.
What to build: A Connected Apps page in your app that shows every third-party application with active access to a user's account. For each connection, display: the app name, the access type (OAuth, API key, or browser extension), the last-access timestamp, the total requests in the last 7 days, and a flag if the connection has been identified as an AI tool.
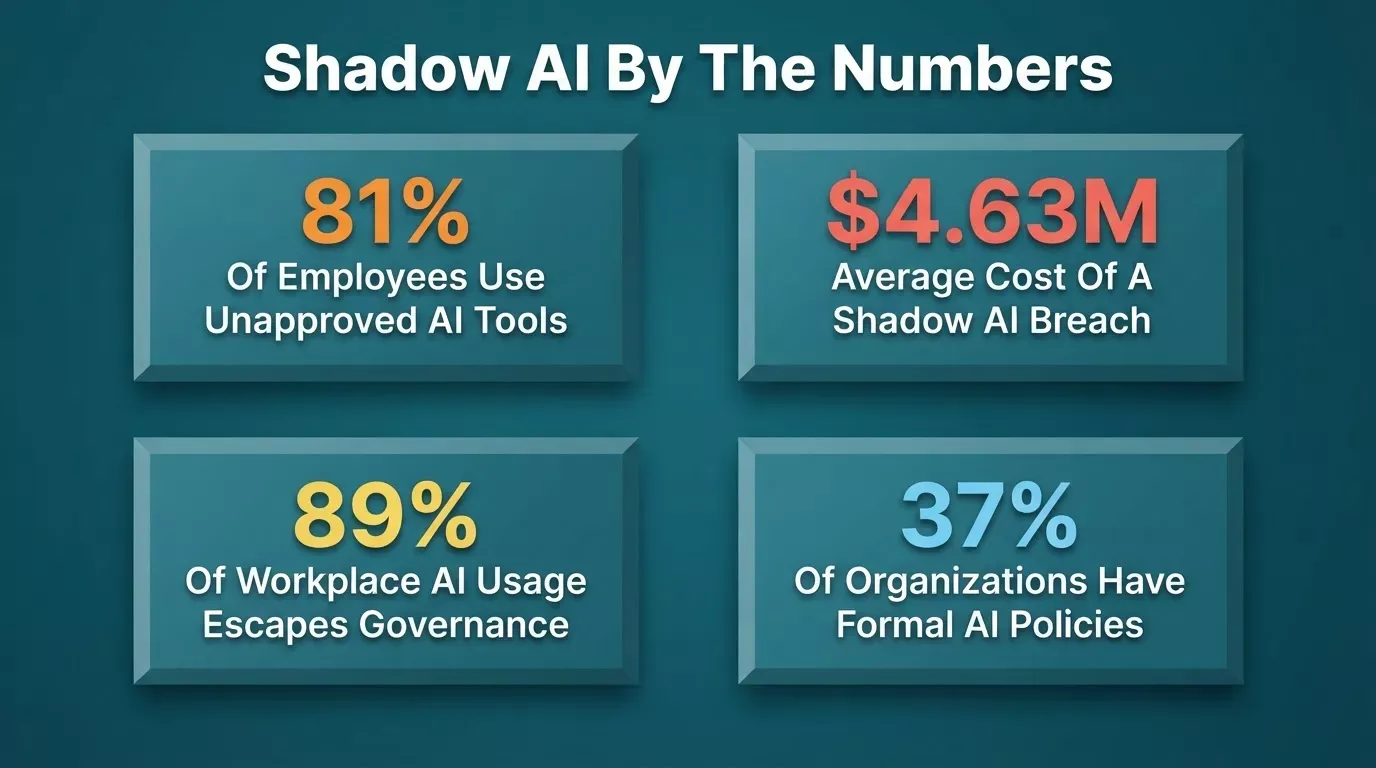
89% of workplace AI usage escapes governance because users simply don't know what tools are connected to their accounts.
How to build it in Rocket.new:
Build a Connected Apps page for authenticated users. Query the api_request_logs table grouped by user_agent to show distinct connected applications. For each app, show: app name (parsed from user_agent), access type, last_seen timestamp, request count in the last 7 days, and an AI Tool badge if the user_agent matches the AI flag list. Include a Revoke button beside each entry. Use a clean card layout with a data table.
Rocket.new generates the full page with the data table, badge logic, and card layout. You can use a template for the dashboard shell and customize from there.
What you get: A self-service transparency layer. Users see what is connected, when their data was last accessed, and how much data was accessed. Most users will voluntarily revoke connections they do not recognize.
Build Layer 4: Add Revoke Access
The final layer closes the loop. When a user or admin identifies an unauthorized AI tool, they need to cut access immediately without filing a ticket or waiting for an IT response.
What to build: A revoke endpoint that, when called, invalidates the OAuth token or API key associated with a specific connection. For OAuth connections, this means calling Supabase Auth to revoke the session. For API keys, this means deleting the key record from your keys table. The revoke action should also write a row to an access_revocations audit log.
Add a second admin-level view that shows all flagged anomaly alerts across all users, with the ability to revoke any connection workspace-wide, not just per user.
How to build it in Rocket.new:
Add a Revoke button to each connected app card on the Connected Apps page. On click, call a server-side API route /api/revoke-connection with the session_id and user_id. The route should: revoke the Supabase session for OAuth connections, delete the API key record for key-based connections, write a row to access_revocations with: user_id, connection_type, revoked_at, revoked_by. Return a success state to the UI. Also build an admin page at /admin/anomalies that shows all open rows from anomaly_alerts with a Revoke All button per user.
What you get: One-click revocation for users and workspace-wide revocation for admins. The audit log gives you a record of every revocation for compliance purposes.
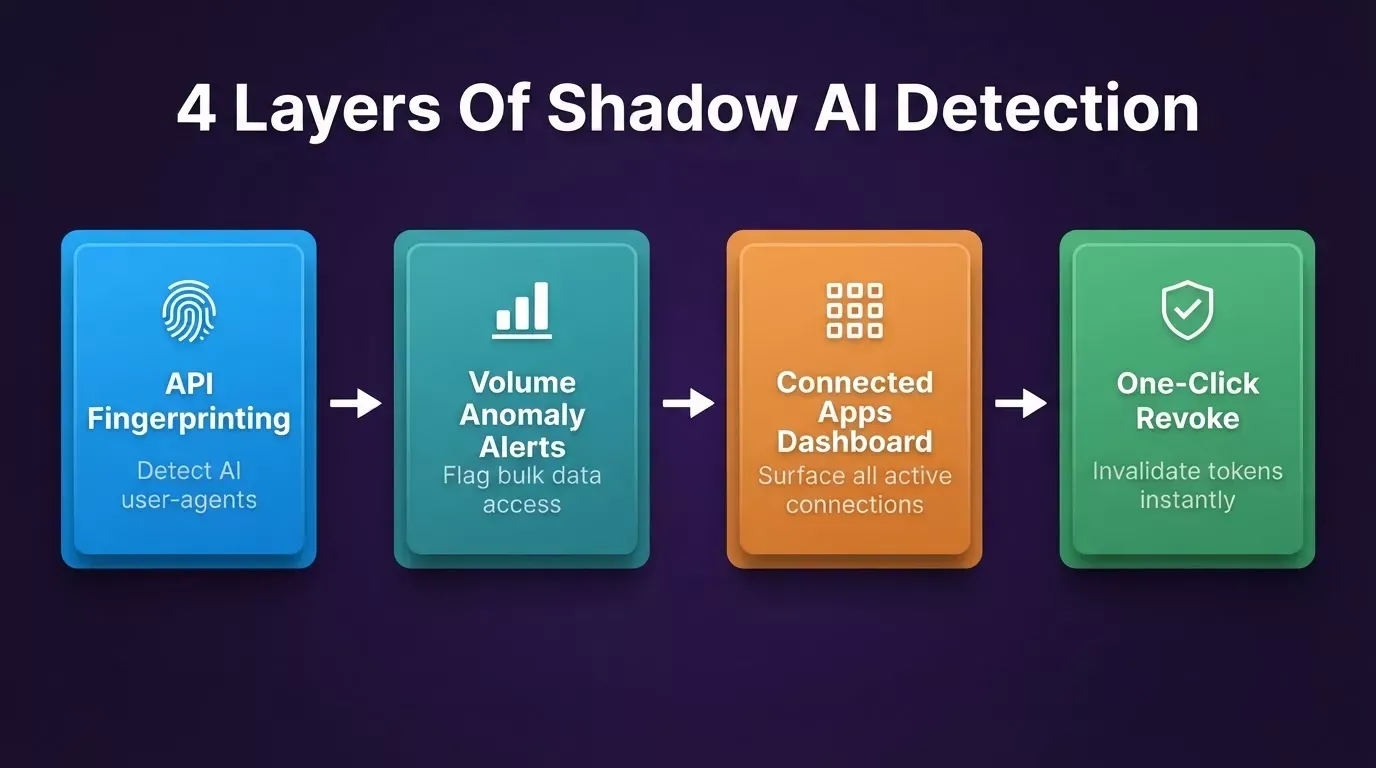
The complete detection flow: API fingerprinting feeds volume anomaly detection, which surfaces in the connected apps dashboard, ending in one-click revocation.
Test It: Normal User vs AI Agent Activity
Before shipping, test your detection system against both traffic types to confirm it fires correctly and does not over-alert.
Test 1: Simulate normal user activity. Log in as a test user and navigate your app naturally for 10 minutes. Click through pages, open records, submit a form. Check your api_request_logs table. You should see: a browser user-agent string, irregular request intervals (2-30 seconds), and a low record count (under 50). No anomaly alert should fire.
Test 2: Simulate AI agent activity. Write a short test script (or ask Rocket.new to generate one) that calls your API with a programmatic user-agent string and makes 300 requests in 5 minutes to your records endpoint. Check your api_request_logs table. You should see: the AI-flagged user-agent, sub-200ms request intervals, and a high record count. An anomaly alert should fire within 5 minutes and appear in your anomaly_alerts table. The admin email should arrive.
Test 3: Simulate the Connected Apps dashboard. After both tests, open the Connected Apps page as the test user. You should see two entries: one for your browser session (normal) and one for the test script (flagged as AI Tool). Click Revoke on the test script entry. Confirm the session is invalidated and the revocation appears in access_revocations.
| Test | User-Agent Flagged | Anomaly Alert Fired | Dashboard Entry | Revoke Works |
|---|---|---|---|---|
| Normal user session | No | No | Yes (unflagged) | N/A |
| AI agent simulation | Yes | Yes (within 5 min) | Yes (AI Tool badge) | Yes |
| Post-revoke access | N/A | N/A | Removed | Confirmed |
False Positives and Edge Cases
No detection system is perfect. Here are the edge cases you will encounter and how to handle them.
Legitimate automation tools. Your own team may use scripts or automation tools (like Zapier, Make, or internal cron jobs) that generate programmatic user-agents. Add a whitelist table in Supabase: approved_agents with columns for user_agent_pattern and approved_by. Before writing to anomaly_alerts, check if the flagged user-agent matches an approved pattern. Ask Rocket.new to add this whitelist check to the Edge Function.
Power users with high read volume. Some legitimate users (analysts, admins) may read large numbers of records in a single session. Add a trusted_users flag to your users table. Exclude trusted users from volume threshold checks, or apply a higher threshold for them. Your admin panel should let you mark users as trusted with one click.
Shared API keys. If your app issues API keys that multiple team members share, a single key may show high volume that is actually distributed across multiple humans. Consider adding a key_type column to your keys table (personal vs shared) and applying different thresholds per type.
Browser extensions that are not AI tools. Password managers, ad blockers, and accessibility tools also inject custom user-agent strings. Refine your AI detection string list to target specific strings like anthropic, openai, claude, gpt, langchain, llm, rather than broad patterns like python or requests.
The right posture: Treat your first week of data as calibration. Review every anomaly alert manually. Adjust thresholds and whitelists based on what you see. After two weeks, the false positive rate should be low enough to trust automated alerts.
What You Have Built
You now have a four-layer shadow AI detection system running inside your SaaS app.
Layer 1 logs every API request with user-agent, timing, and volume data into a Supabase table. It flags AI-tool signatures in real time.
Layer 2 runs a scheduled Edge Function that detects volume anomalies and fires admin alerts within 5 minutes of a suspicious session.
Layer 3 surfaces all connected applications to your users in a transparent dashboard, with AI-tool badges and last-access data, so users can self-govern.
Layer 4 gives users and admins one-click revocation with a full audit trail, closing the loop from detection to response.
This system does what enterprise shadow AI detection products do, at a fraction of the cost, and you own every line of code.
| Capability | Enterprise Vendor | What You Built |
|---|---|---|
| API request fingerprinting | Included | Middleware in Layer 1 |
| Volume anomaly detection | Included | Edge Function in Layer 2 |
| Connected apps dashboard | Included | Next.js page in Layer 3 |
| One-click token revocation | Included | Server-side route in Layer 4 |
| Audit log | Included | access_revocations table |
| Procurement timeline | 3-6 months | Days to weeks |
| Code ownership | Vendor-controlled | You own it |
Rocket.new also ships apps with web application security best practices built in by default, including HTTPS enforcement, environment variable isolation, and Supabase row-level security, so your detection layer starts from a secure foundation.
Build Your Version in Rocket.new
Enterprise shadow AI detection products charge six-figure contracts and require months of procurement. You have just built the equivalent in four layers, each generated from a plain-language description in Rocket.new.
Rocket.new is a vibe solutioning platform that combines three capabilities in one workspace. Solve turns complex business questions into structured, evidence-backed research reports. Build generates production-ready Next.js web apps and Flutter mobile apps from plain-language descriptions. Intelligence watches competitors across nine signal pillars: website, social, news, GTM, traffic, product, people, business, and reviews, and delivers personalized Intel cards framed to your role and strategic questions.
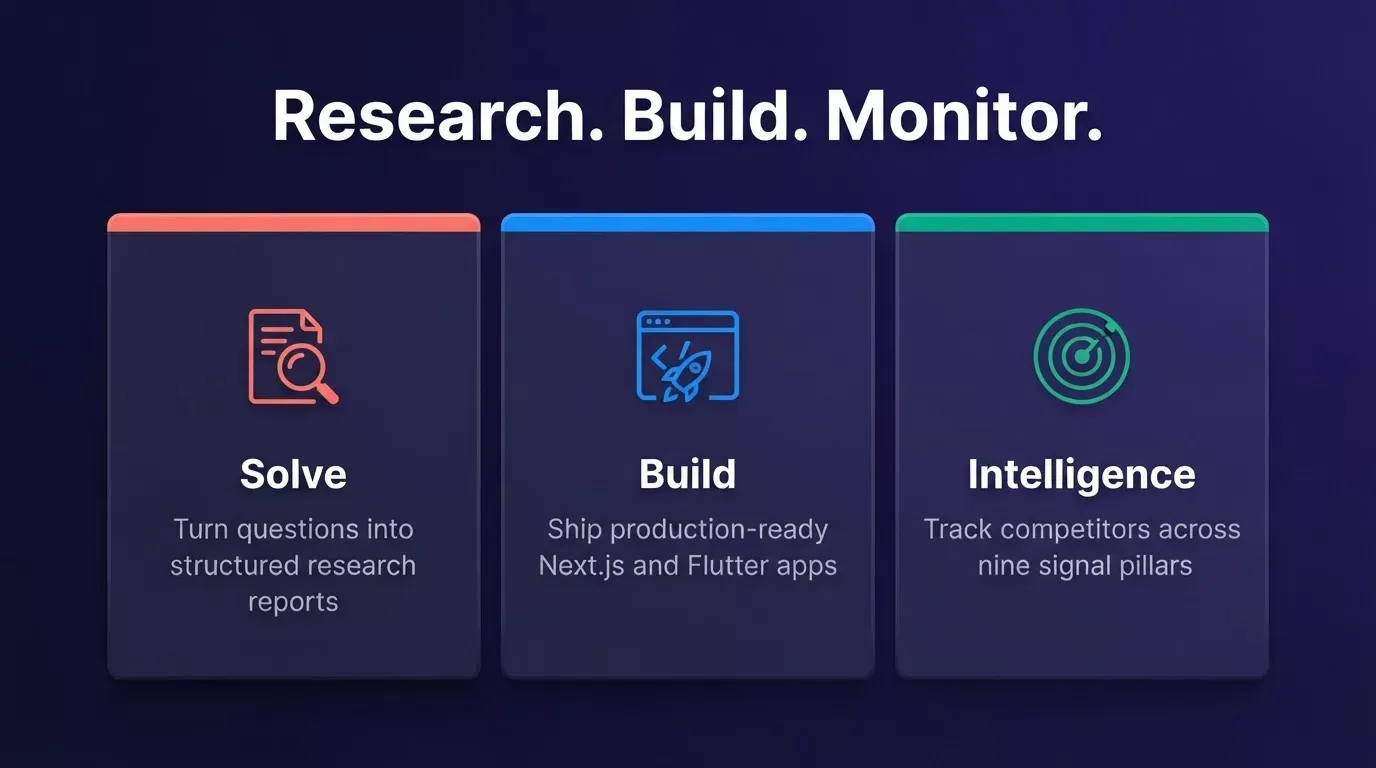
Use Solve to research the shadow AI vendor landscape, Build to ship your detection system, and Intelligence to track how competitors handle AI governance.
Step 1: Open a new Build task. Describe your app architecture and ask Rocket.new to scaffold the api_request_logs table and middleware. Connect your Supabase project using the one-click deployment workflow and the connector authenticates once.
Step 2: Add the anomaly detection Edge Function. Continue in the same task or use @-mentions to pull the Layer 1 context into a new task. Every task in a project inherits the same files, integrations, and prior decisions, so you never re-explain what you have already built. This is the same approach teams use to build internal tools without a developer.
Step 3: Build the Connected Apps dashboard. Describe the page layout and data requirements. Rocket.new generates the full Next.js page with the data table, badge logic, and revoke button wired to your API route. Start from a template to move faster.
Step 4: Publish to staging, then production. Rocket.new deploys your app to a staging URL where you can run the test scenarios from the previous section. When tests pass, connect a custom domain and deploy to Netlify with one click for a live URL, automatic HTTPS, and CDN hosting.
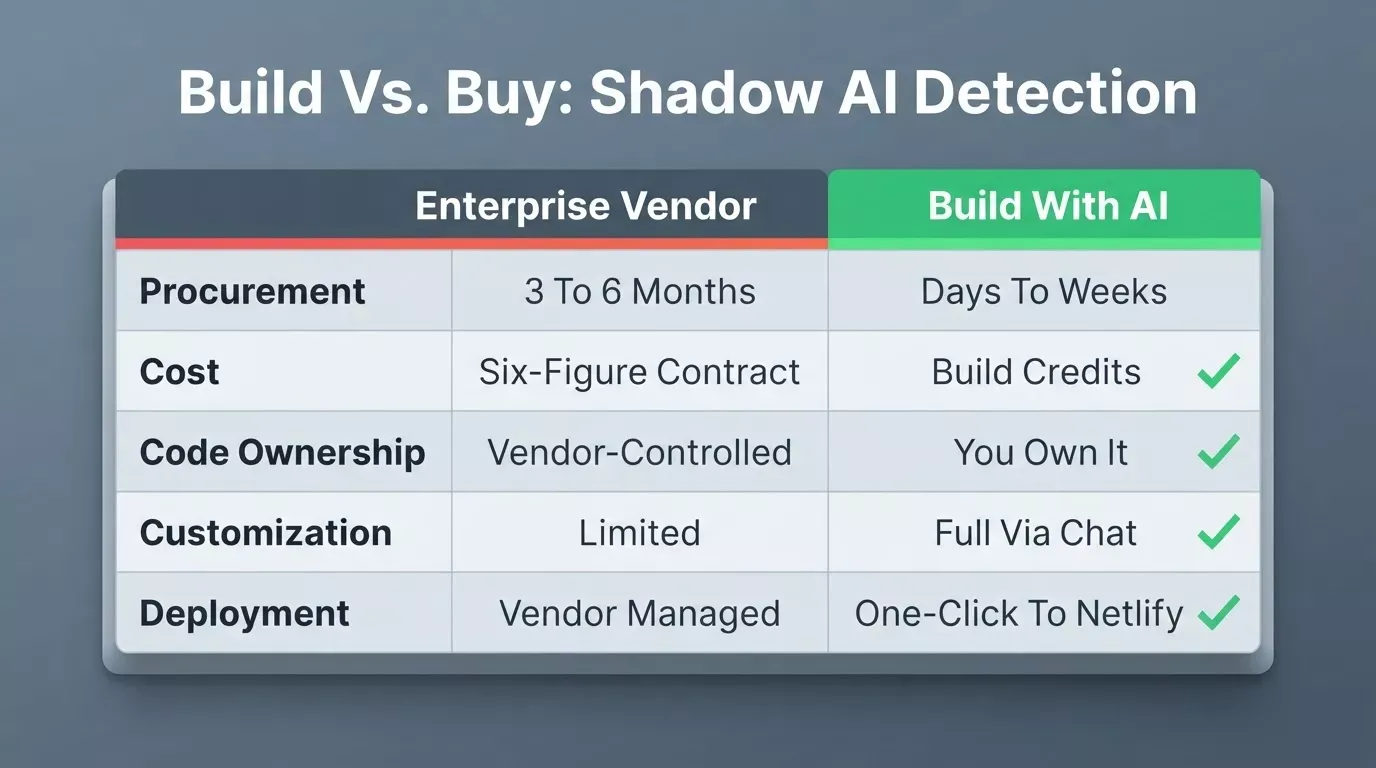
Building your own detection layer gives you full code ownership and chat-driven customization at a fraction of the enterprise vendor cost.
Traditional security vendors treat shadow AI detection as a monitoring product you subscribe to. Rocket.new treats it as a feature you own, built into your application, under your control, shipping on your timeline.
Shadow AI is already inside your apps. The only question is whether you can see it. Sign up and start building.
Table of contents
- -What Shadow AI Looks Like Inside a SaaS App
- -Example SaaS Architecture and Attack Scenario
- -What Signals Can Identify Suspicious AI Activity
- -Build Layer 1: Log Suspicious API Activity in Rocket.new
- -Build Layer 2: Detect Unusual Access Volume
- -Build Layer 3: Build the Connected Apps Dashboard
- -Build Layer 4: Add Revoke Access
- -Test It: Normal User vs AI Agent Activity
- -False Positives and Edge Cases
- -What You Have Built
- -Build Your Version in Rocket.new